Notes after learning some stuff on OpenTelemetry.
New: some of the code has been generated with ChatGPT!
It seems that Telemetry refers to separate classes of data:
- Metrics: they are instant numbers, for example a temperature, the level of charge in a battery, the free memory or the used CPU.
- Traces: traces are segments, something like “The backup ran between 20:00 and 20:05”.
- Logs: standard log files, dumped to local files but uploaded to a centralized location
- Events - to learn more about them.
Started by creating a simple Java project to generate metrics and traces. Adding the following dependencies:
    <!-- Project dependencies -->
    <dependencies>
        <dependency>
            <groupId>io.opentelemetry</groupId>
            <artifactId>opentelemetry-sdk</artifactId>
            <version>1.14.0</version>
        </dependency>
        <dependency>
            <groupId>io.opentelemetry</groupId>
            <artifactId>opentelemetry-exporter-jaeger</artifactId>
            <version>1.14.0</version>
        </dependency>

        <dependency>
            <groupId>io.opentelemetry</groupId>
            <artifactId>opentelemetry-api-metrics</artifactId>
            <version>1.9.0-alpha</version>
        </dependency>
        <dependency>
            <groupId>io.opentelemetry</groupId>
            <artifactId>opentelemetry-sdk-metrics</artifactId>
            <version>1.14.0</version>
        </dependency>
        <dependency>
            <groupId>io.opentelemetry</groupId>
            <artifactId>opentelemetry-exporter-otlp-http-metrics</artifactId>
            <version>1.14.0</version>
        </dependency>
    </dependencies>
The option here is to export metrics to gRPC/Jaeger and Traces using OTLP.
package com.example;
import io.opentelemetry.api.OpenTelemetry;
import io.opentelemetry.api.metrics.LongCounter;
import io.opentelemetry.api.metrics.Meter;
import io.opentelemetry.api.trace.StatusCode;
import io.opentelemetry.exporter.jaeger.JaegerGrpcSpanExporter;
import io.opentelemetry.api.trace.Span;
import io.opentelemetry.api.trace.Tracer;
import io.opentelemetry.context.Scope;
import io.opentelemetry.exporter.otlp.http.metrics.OtlpHttpMetricExporter;
import io.opentelemetry.sdk.OpenTelemetrySdk;
import io.opentelemetry.sdk.metrics.SdkMeterProvider;
import io.opentelemetry.sdk.metrics.export.PeriodicMetricReader;
import io.opentelemetry.sdk.resources.Resource;
import io.opentelemetry.sdk.trace.SdkTracerProvider;
import io.opentelemetry.sdk.trace.export.BatchSpanProcessor;
import io.opentelemetry.sdk.trace.samplers.Sampler;


import java.util.Date;
import java.util.Random;
import java.util.concurrent.TimeUnit;

public class Example {


    Tracer tracer;
    LongCounter counter;
    double sineValue = 0;
    Resource resource = Resource.builder().put("service.name","theTestService").build();


    private Example() {
        buildTracer();
        buildMeter();

        new SinGenerator().start();
    }


    private void buildMeter() {

        OtlpHttpMetricExporter metricExporter = OtlpHttpMetricExporter.builder()
                .setEndpoint("http://localhost:4318/v1/metrics")
//                .setAggregationTemporalitySelector(AggregationTemporalitySelector.deltaPreferred())
                .build();

        SdkMeterProvider meterProvider = SdkMeterProvider.builder()
                .setResource(resource) //.setResource(dtMetadata)
                .registerMetricReader(PeriodicMetricReader.builder(metricExporter).setInterval(500, TimeUnit.MILLISECONDS).build()) //The metricExporter setup is explained in Step 2.
                .build();

        OpenTelemetry openTelemetry = OpenTelemetrySdk
                .builder()
                .setMeterProvider(meterProvider)
                .buildAndRegisterGlobal();

        Meter meter = openTelemetry
                .meterBuilder("my-meter")
                .setInstrumentationVersion("1.0.0")
                .build();

        counter = meter
                .counterBuilder("my-counter")
                .setDescription("This is my counter.")
                .build();
         meter.gaugeBuilder("sinewave")
                .setDescription("Should look like a sine wave")
                .setUnit("meter").buildWithCallback(x-> x.record(sineValue));

    }

    private void buildTracer () {
        // Create a Jaeger exporter with the ManagedChannel
        JaegerGrpcSpanExporter jaegerExporter = JaegerGrpcSpanExporter.builder()
                .setEndpoint("http://localhost:14250")
                .setTimeout(160, TimeUnit.SECONDS) // makes no difference - maybe an error timeout?
                .build();

        // Create a TracerProvider with a batch span processor and a probabilistic sampler
        SdkTracerProvider tracerProvider = SdkTracerProvider.builder()
                .addSpanProcessor(BatchSpanProcessor.builder(jaegerExporter).build())
                .setSampler(Sampler.traceIdRatioBased(0.5))
                .setResource(resource)
                .build();

        // Set the global TracerProvider
        OpenTelemetrySdk openTelemetrySdk = OpenTelemetrySdk.builder()
                .setTracerProvider(tracerProvider)
                .build();
        // OpenTelemetry.setGlobalOpenTelemetry(openTelemetrySdk);

        // Get the Tracer
        tracer = openTelemetrySdk.getTracer("example");
    }


    void loop() throws InterruptedException {
        while (true) {
            // Start a new Span
            counter.add(1);
            counter.add(new Random().nextInt(5));
            Span span = tracer.spanBuilder("example-span").startSpan();
            try (Scope scope = span.makeCurrent()) {
                // Do some work
                Thread.sleep(1000);
                // Add an attribute to the Span
                span.setAttribute("key", "value");
            } finally {
                // End the Span
                span.end();
            }
            counter.add(new Random().nextInt(3));
            Thread.sleep(1000);
        }
    }


    class SinGenerator extends Thread {
        @Override
        public void run() {
            Random rnd = new Random();
            while (true) {
                Span span = tracer.spanBuilder("sinewave").startSpan();
                Span span2 = tracer.spanBuilder("coswave").startSpan();

                try {
                    Thread.sleep((long) (20 + rnd.nextDouble()*50));
                } catch (InterruptedException e) {
                    e.printStackTrace();
                }
                sineValue = Math.sin(new Date().getTime()*Math.PI*2 / 1000 / 7); // every 7 seconds a revolution
                double sineValue2 = Math.cos(new Date().getTime()*Math.PI*2 / 1000 / 15) * 5; // every 15 seconds a revolution
                span.setAttribute("value", sineValue);
                if (rnd.nextInt(70) == 42) {
                    span.setStatus(StatusCode.ERROR);
                    span.addEvent("Error: some error");
                }
                    else
                    span.setStatus(StatusCode.OK);
                span.end();
                span2.setAttribute("value", sineValue2);
                span2.setStatus(StatusCode.OK);
                span2.end();

//                System.out.println("Sin value: " + sineValue);
            }
        }
    }

    public static void main(String[] args) throws Exception{

        Example ex = new Example();

        ex.loop();

    }
}
This code does a lot. It initializes both metrics and traces exporters. It then runs a loop to generate spans and increment counters and runs another thread to produce spans with a value in the form of a sinewave.
The Java code connects to a collector. Even if the collector is not available the rest of the code will execute properly while outputing an error.
I’ve used otel collector to read the telemetry. Exemplifying everything in a docker-compose file.
  otel-collector:
    image: otel/opentelemetry-collector-contrib:latest
    volumes:
      - ./otel-collector-config.yaml:/etc/otel/collector-config.yaml:ro
    ports:
      - "4318:4318" # Otlp
      - "14250:14250"
    restart: always
    command: ["--config", "/etc/otel/collector-config.yaml" ]
Otel-collector is configured to write the metrics to Prometheus and the traces both to Jaeger and ElasticSearch. The configuration file is as following:
receivers:
  otlp: # metrics
    protocols:
      http:
        endpoint: 0.0.0.0:4318
  jaeger: # tracers`
    protocols:
      grpc:
        endpoint: 0.0.0.0:14250


exporters:
  prometheus:
    endpoint: 0.0.0.0:9464
  jaeger:
    endpoint: "http://jaeger:14250"
    tls:
      insecure: true
  elasticsearch:
    endpoints: [http://es:9200]
    tls:
      insecure_skip_verify: true
  skywalking:
    endpoints: [http://skywalking:9200]


  logging:
    verbosity: detailed
    sampling_initial: 5
    sampling_thereafter: 200


service:
  pipelines:
    traces:
      receivers: [jaeger]
      exporters: [jaeger,elasticsearch]
    metrics:
      receivers: [otlp]
      exporters: [prometheus]
Further we configure Prometheus:
  prometheus:
    image: prom/prometheus:v2.30.3
    command: --config.file=/etc/prometheus/prometheus.yml --log.level=debug
    volumes:
      - ./prometheus.yml:/etc/prometheus/prometheus.yml:ro
Prometheus will connect to otel-collector to retrieve the metrics. Also Prometheus can connect to itself and other metrics providers to store the telemetry. This is the configuration file:
global:
  scrape_interval: 15s

# A scrape configuration containing exactly one endpoint to scrape:
# Here it's Prometheus itself.
scrape_configs:
  - job_name: 'prometheus'
    scrape_interval: 5s
    static_configs:
      - targets: ['prometheus:9090']

  - job_name: 'graphana'
    scrape_interval: 5s
    static_configs:
      - targets: ['grafana:3000']

  - job_name: 'otel'
    scrape_interval: 1s
    static_configs:
      - targets: ['otel-collector:9464']

  - job_name: 'otel-self'
    scrape_interval: 5s
    static_configs:
      - targets: ['otel-collector:8888']
The rest of docker containers. Note that grafana can read a list of data sources; however the data sources can be created using the GUI too.
  grafana:
    image: grafana/grafana:latest
    volumes:
      - ./grafana-datasource.yaml:/etc/grafana/provisioning/datasources/grafana-datasource.yaml:ro
      - grafana-storage:/var/lib/grafana
    ports:
      - "3000:3000"
    depends_on:
      - prometheus
      - jaeger
    restart: always

  jaeger:
    image: jaegertracing/all-in-one:latest

  es:
    image: docker.elastic.co/elasticsearch/elasticsearch:8.6.2
    environment:
      - xpack.security.enabled=false
      - "discovery.type=single-node"
    ports:
      - 9200:9200

volumes:
  grafana-storage:
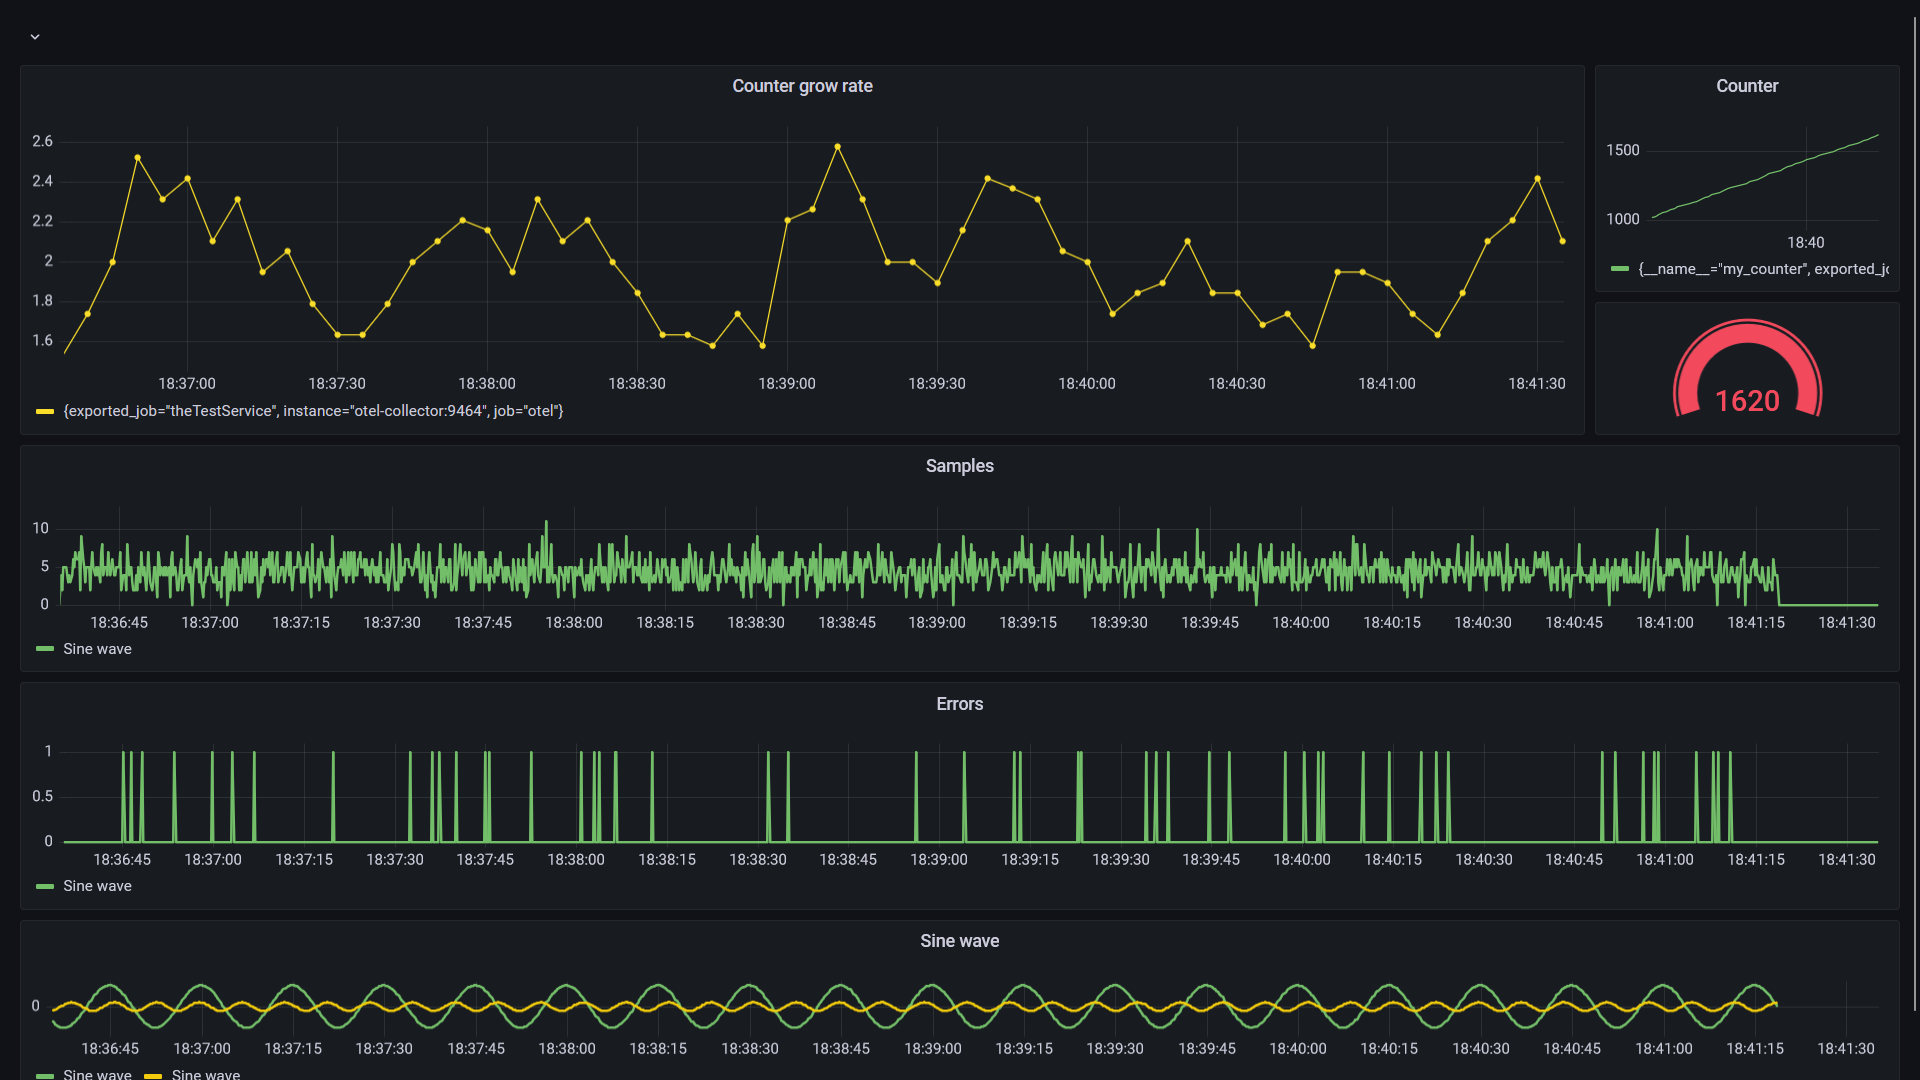
Grafana allows to create and edit the dashboards.
{
"annotations": {
"list": [
{
"builtIn": 1,
"datasource": {
"type": "grafana",
"uid": "-- Grafana --"
},
"enable": true,
"hide": true,
"iconColor": "rgba(0, 211, 255, 1)",
"name": "Annotations & Alerts",
"target": {
"limit": 100,
"matchAny": false,
"tags": [],
"type": "dashboard"
},
"type": "dashboard"
}
]
},
"editable": true,
"fiscalYearStartMonth": 0,
"graphTooltip": 0,
"id": 4,
"links": [],
"liveNow": false,
"panels": [
{
"collapsed": false,
"gridPos": {
"h": 1,
"w": 24,
"x": 0,
"y": 0
},
"id": 8,
"panels": [],
"type": "row"
},
{
"datasource": {
"type": "prometheus",
"uid": "PBFA97CFB590B2093"
},
"fieldConfig": {
"defaults": {
"color": {
"mode": "palette-classic"
},
"custom": {
"axisCenteredZero": false,
"axisColorMode": "text",
"axisLabel": "",
"axisPlacement": "auto",
"barAlignment": 0,
"drawStyle": "line",
"fillOpacity": 0,
"gradientMode": "none",
"hideFrom": {
"legend": false,
"tooltip": false,
"viz": false
},
"lineInterpolation": "linear",
"lineWidth": 1,
"pointSize": 5,
"scaleDistribution": {
"type": "linear"
},
"showPoints": "auto",
"spanNulls": false,
"stacking": {
"group": "A",
"mode": "none"
},
"thresholdsStyle": {
"mode": "off"
}
},
"mappings": [],
"thresholds": {
"mode": "absolute",
"steps": [
{
"color": "green",
"value": null
},
{
"color": "red",
"value": 80
}
]
}
},
"overrides": [
{
"matcher": {
"id": "byName",
"options": "{exported_job=\"theTestService\", instance=\"otel-collector:9464\", job=\"otel\"}"
},
"properties": [
{
"id": "color",
"value": {
"fixedColor": "yellow",
"mode": "fixed"
}
}
]
}
]
},
"gridPos": {
"h": 8,
"w": 20,
"x": 0,
"y": 1
},
"id": 4,
"options": {
"legend": {
"calcs": [],
"displayMode": "list",
"placement": "bottom",
"showLegend": true
},
"tooltip": {
"mode": "single",
"sort": "none"
}
},
"targets": [
{
"datasource": {
"type": "prometheus",
"uid": "PBFA97CFB590B2093"
},
"editorMode": "builder",
"expr": "rate(my_counter[$__rate_interval])",
"legendFormat": "__auto",
"range": true,
"refId": "A"
}
],
"title": "Counter grow rate",
"type": "timeseries"
},
{
"datasource": {
"type": "prometheus",
"uid": "PBFA97CFB590B2093"
},
"fieldConfig": {
"defaults": {
"color": {
"mode": "palette-classic"
},
"custom": {
"axisCenteredZero": false,
"axisColorMode": "text",
"axisLabel": "",
"axisPlacement": "auto",
"barAlignment": 0,
"drawStyle": "line",
"fillOpacity": 0,
"gradientMode": "none",
"hideFrom": {
"legend": false,
"tooltip": false,
"viz": false
},
"lineInterpolation": "linear",
"lineWidth": 1,
"pointSize": 5,
"scaleDistribution": {
"type": "linear"
},
"showPoints": "auto",
"spanNulls": false,
"stacking": {
"group": "A",
"mode": "none"
},
"thresholdsStyle": {
"mode": "off"
}
},
"mappings": [],
"thresholds": {
"mode": "absolute",
"steps": [
{
"color": "green",
"value": null
},
{
"color": "red",
"value": 80
}
]
}
},
"overrides": []
},
"gridPos": {
"h": 5,
"w": 4,
"x": 20,
"y": 1
},
"id": 6,
"options": {
"legend": {
"calcs": [],
"displayMode": "list",
"placement": "bottom",
"showLegend": true
},
"tooltip": {
"mode": "single",
"sort": "none"
}
},
"targets": [
{
"datasource": {
"type": "prometheus",
"uid": "PBFA97CFB590B2093"
},
"editorMode": "builder",
"expr": "my_counter",
"legendFormat": "__auto",
"range": true,
"refId": "A"
}
],
"title": "Counter",
"type": "timeseries"
},
{
"datasource": {
"type": "prometheus",
"uid": "PBFA97CFB590B2093"
},
"fieldConfig": {
"defaults": {
"color": {
"mode": "thresholds"
},
"mappings": [],
"thresholds": {
"mode": "absolute",
"steps": [
{
"color": "green",
"value": null
},
{
"color": "red",
"value": 80
}
]
}
},
"overrides": []
},
"gridPos": {
"h": 3,
"w": 4,
"x": 20,
"y": 6
},
"id": 10,
"options": {
"orientation": "auto",
"reduceOptions": {
"calcs": [
"lastNotNull"
],
"fields": "",
"values": false
},
"showThresholdLabels": false,
"showThresholdMarkers": true
},
"pluginVersion": "9.3.6",
"targets": [
{
"datasource": {
"type": "prometheus",
"uid": "PBFA97CFB590B2093"
},
"editorMode": "builder",
"expr": "my_counter",
"legendFormat": "__auto",
"range": true,
"refId": "A"
}
],
"type": "gauge"
},
{
"datasource": {
"type": "elasticsearch",
"uid": "HMpnlLa4k"
},
"fieldConfig": {
"defaults": {
"color": {
"mode": "palette-classic"
},
"custom": {
"axisCenteredZero": false,
"axisColorMode": "text",
"axisLabel": "",
"axisPlacement": "auto",
"barAlignment": 0,
"drawStyle": "line",
"fillOpacity": 0,
"gradientMode": "none",
"hideFrom": {
"legend": false,
"tooltip": false,
"viz": false
},
"lineInterpolation": "linear",
"lineStyle": {
"fill": "solid"
},
"lineWidth": 2,
"pointSize": 5,
"scaleDistribution": {
"type": "linear"
},
"showPoints": "never",
"spanNulls": true,
"stacking": {
"group": "A",
"mode": "none"
},
"thresholdsStyle": {
"mode": "off"
}
},
"displayName": "Sine wave",
"mappings": [],
"thresholds": {
"mode": "absolute",
"steps": [
{
"color": "green",
"value": null
}
]
},
"unit": "none"
},
"overrides": [
{
"matcher": {
"id": "byName",
"options": "Count"
},
"properties": [
{
"id": "custom.axisLabel",
"value": "Sample count"
},
{
"id": "custom.axisPlacement",
"value": "right"
}
]
}
]
},
"gridPos": {
"h": 5,
"w": 24,
"x": 0,
"y": 9
},
"id": 2,
"options": {
"legend": {
"calcs": [],
"displayMode": "list",
"placement": "bottom",
"showLegend": true
},
"timezone": [
"browser"
],
"tooltip": {
"mode": "single",
"sort": "none"
}
},
"targets": [
{
"alias": "",
"bucketAggs": [
{
"field": "@timestamp",
"id": "2",
"settings": {
"interval": "auto"
},
"type": "date_histogram"
}
],
"datasource": {
"type": "elasticsearch",
"uid": "HMpnlLa4k"
},
"hide": false,
"metrics": [
{
"hide": false,
"id": "1",
"type": "count"
}
],
"query": "",
"refId": "ABC123",
"timeField": "@timestamp"
}
],
"title": "Samples",
"type": "timeseries"
},
{
"datasource": {
"type": "elasticsearch",
"uid": "HMpnlLa4k"
},
"description": "",
"fieldConfig": {
"defaults": {
"color": {
"mode": "palette-classic"
},
"custom": {
"axisCenteredZero": false,
"axisColorMode": "text",
"axisLabel": "",
"axisPlacement": "auto",
"barAlignment": 0,
"drawStyle": "line",
"fillOpacity": 0,
"gradientMode": "none",
"hideFrom": {
"legend": false,
"tooltip": false,
"viz": false
},
"lineInterpolation": "linear",
"lineStyle": {
"fill": "solid"
},
"lineWidth": 2,
"pointSize": 5,
"scaleDistribution": {
"type": "linear"
},
"showPoints": "never",
"spanNulls": true,
"stacking": {
"group": "A",
"mode": "none"
},
"thresholdsStyle": {
"mode": "off"
}
},
"displayName": "Sine wave",
"mappings": [],
"thresholds": {
"mode": "absolute",
"steps": [
{
"color": "green",
"value": null
}
]
},
"unit": "none"
},
"overrides": [
{
"matcher": {
"id": "byName",
"options": "Count"
},
"properties": [
{
"id": "custom.axisLabel",
"value": "Sample count"
},
{
"id": "custom.axisPlacement",
"value": "right"
}
]
}
]
},
"gridPos": {
"h": 5,
"w": 24,
"x": 0,
"y": 14
},
"id": 12,
"options": {
"legend": {
"calcs": [],
"displayMode": "list",
"placement": "bottom",
"showLegend": true
},
"timezone": [
"browser"
],
"tooltip": {
"mode": "single",
"sort": "none"
}
},
"targets": [
{
"alias": "",
"bucketAggs": [
{
"field": "@timestamp",
"id": "2",
"settings": {
"interval": "auto"
},
"type": "date_histogram"
}
],
"datasource": {
"type": "elasticsearch",
"uid": "HMpnlLa4k"
},
"hide": false,
"metrics": [
{
"hide": false,
"id": "1",
"type": "count"
}
],
"query": "TraceStatus:2",
"refId": "ABC123",
"timeField": "@timestamp"
}
],
"title": "Errors",
"type": "timeseries"
},
{
"datasource": {
"type": "elasticsearch",
"uid": "HMpnlLa4k"
},
"fieldConfig": {
"defaults": {
"color": {
"mode": "palette-classic"
},
"custom": {
"axisCenteredZero": false,
"axisColorMode": "text",
"axisLabel": "",
"axisPlacement": "auto",
"barAlignment": 0,
"drawStyle": "line",
"fillOpacity": 0,
"gradientMode": "none",
"hideFrom": {
"legend": false,
"tooltip": false,
"viz": false
},
"lineInterpolation": "linear",
"lineStyle": {
"fill": "solid"
},
"lineWidth": 2,
"pointSize": 5,
"scaleDistribution": {
"type": "linear"
},
"showPoints": "never",
"spanNulls": true,
"stacking": {
"group": "A",
"mode": "none"
},
"thresholdsStyle": {
"mode": "off"
}
},
"displayName": "Sine wave",
"mappings": [],
"thresholds": {
"mode": "absolute",
"steps": [
{
"color": "green",
"value": null
}
]
},
"unit": "none"
},
"overrides": [
{
"matcher": {
"id": "byName",
"options": "Count"
},
"properties": [
{
"id": "custom.axisLabel",
"value": "Sample count"
},
{
"id": "custom.axisPlacement",
"value": "hidden"
}
]
}
]
},
"gridPos": {
"h": 4,
"w": 24,
"x": 0,
"y": 19
},
"id": 11,
"options": {
"legend": {
"calcs": [],
"displayMode": "list",
"placement": "bottom",
"showLegend": true
},
"timezone": [
"browser"
],
"tooltip": {
"mode": "single",
"sort": "none"
}
},
"targets": [
{
"alias": "",
"bucketAggs": [
{
"field": "@timestamp",
"id": "2",
"settings": {
"interval": "auto"
},
"type": "date_histogram"
}
],
"datasource": {
"type": "elasticsearch",
"uid": "HMpnlLa4k"
},
"hide": false,
"metrics": [
{
"field": "Attributes.value",
"id": "1",
"type": "avg"
}
],
"query": "Name:coswave",
"refId": "B",
"timeField": "@timestamp"
},
{
"alias": "",
"bucketAggs": [
{
"field": "@timestamp",
"id": "2",
"settings": {
"interval": "auto"
},
"type": "date_histogram"
}
],
"datasource": {
"type": "elasticsearch",
"uid": "HMpnlLa4k"
},
"hide": false,
"metrics": [
{
"field": "Attributes.value",
"id": "1",
"type": "avg"
}
],
"query": "Name:sinewave",
"refId": "A",
"timeField": "@timestamp"
}
],
"title": "Sine wave",
"type": "timeseries"
}
],
"refresh": "5s",
"schemaVersion": 37,
"style": "dark",
"tags": [],
"templating": {
"list": []
},
"time": {
"from": "now-5m",
"to": "now"
},
"timepicker": {},
"timezone": "",
"title": "Elastic Prometheus",
"uid": "xsQP3La4k",
"version": 6,
"weekStart": ""
}
Some notes:
- I could not plot the attribute “value” from Jaeger. The only plotable metric from Jaeger is the segment duration. https://community.grafana.com/t/how-to-plot-a-span-attribute-in-jaeger-data-source/83871
- The dashboard has an inertia of 20-30 seconds when plotting the segments. The metrics look live. Explaining this as ElasticSearch has eventual persistency.
- Would be interesting to find a way to transmit the metrics and traces through UDP. This would greatly release the microcontrollers of the need to maintain additional TCP connections. Eventually this can be achieved by getting the telemetry data by UDP to a gateway which will further transmit using TCP.
- Would be interesting to see how Otel-Collector saves to Postgres. (I read this before but I don’t remember where).
- Explore SkyWalking, this is a corresponding Apache project.